ICBA ECONOMICS: Where B.C. and Alberta Stand on Corporate Head Offices
Statistics Canada’s survey highlights the growth of corporate head offices in B.C. and Alberta, underscoring their economic impact and employment...
2 min read
Statistics Canada regularly produces information on an array of economic indicators of interest to business decision-makers, investors and households. Earlier this month, the agency published data on “provincial and territorial accounts” for 2025 and prior years. The data includes estimates of both the level and growth of real (inflation-adjusted) gross domestic product (GDP), which allow us to chart the evolution of economic activity nationally and for each province/territory.
Figure 1 summarizes economic growth across the country in 2025. Amid President Trump’s chaotic tariff wars, the Canadian economy performed better than expected, with real GDP climbing by 1.9% from 2024. Alberta posted growth of 3.3%, while B.C. managed a respectable 2.4%. Quebec, Ontario and Manitoba recorded below-average growth rates in 2025.
The statistics underlying Figure 1 refer to GDP based on expenditures; an alternative way to calculate GDP – one that is not considered in this post – is to track the value of output or production across the industries that make up the economy. We will explore trends in GDP by industry in a future ICBA Economics post.
Figure 1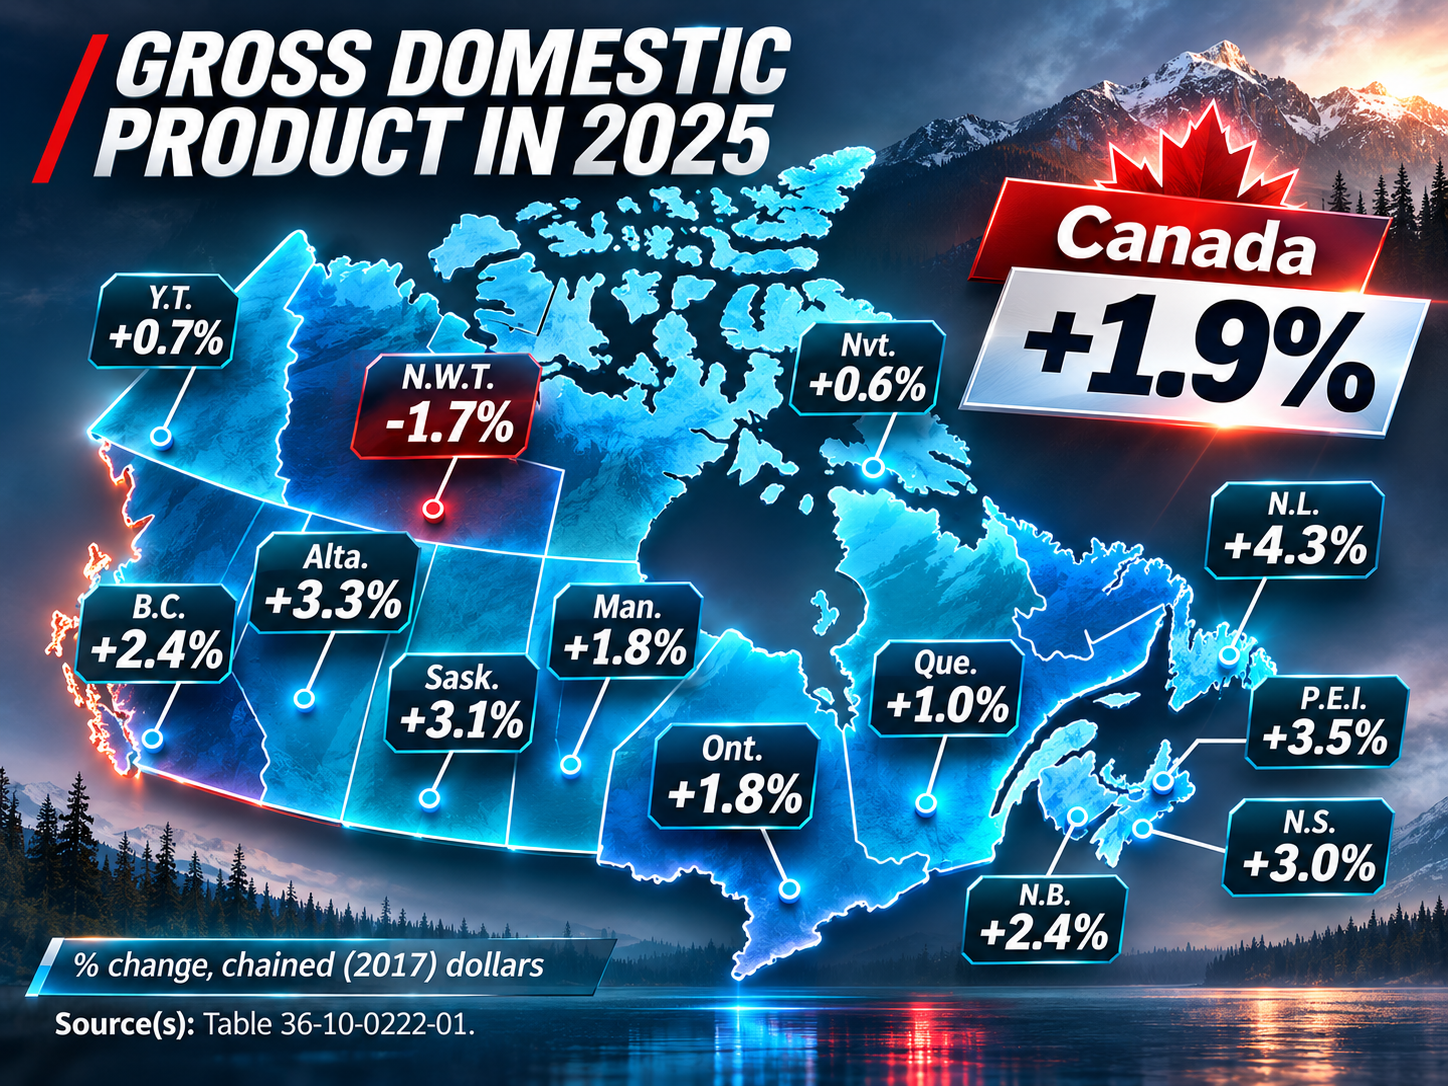
Figure 2 shows the components of GDP by broad category of expenditure for Canada in 2025, 2024 and 2022, together with the level of real GDP for each component. The principal categories are household spending; government consumption spending (i.e., non-capital outlays); total investment (which includes housing investment, private sector non-residential investment, and government capital spending); and “net” exports – the GDP value of exports minus imports.
Canadian household spending (adjusted for inflation) rose by 2% in 2025, marginally faster than economy-wide spending (+1.9%). Real government outlays on goods, services and income transfers grew by 2.4% – note that this category does not capture public sector capital spending, which also rose in 2025. Real Canadian exports declined in 2025, while real imports were essentially unchanged from the year before. Total investment – “gross fixed capital formation” – advanced by 1.5% in 2025 but exhibited almost no growth over 2022-2024. By 2025, Canada’s real GDP was 6% higher than in 2022 – equivalent to approximately zero growth on a per-person basis.
Figure 2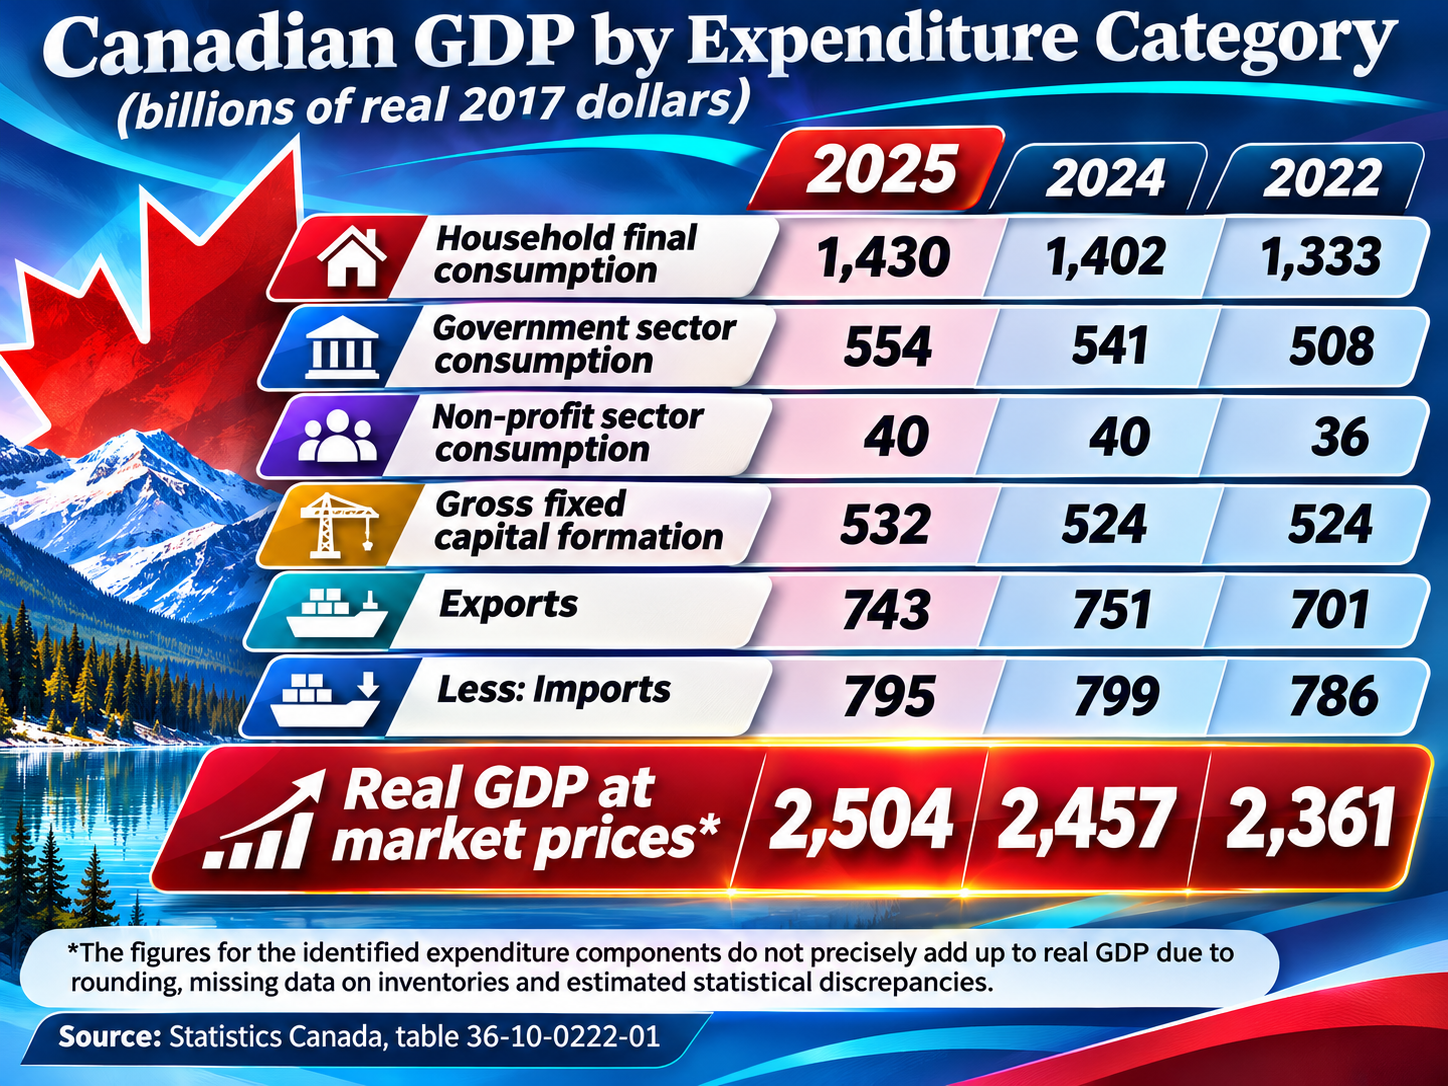
Focus on B.C. and Alberta
Figure 3 provides data on what happened to the principal expenditure components of GDP as well as total GDP in B.C. and Alberta over the same period. Real GDP in B.C. rose by 6.7% from 2022 to 2025. Alberta enjoyed stronger growth – almost 10% – over the same period.
The absolute level of GDP is higher in Alberta than in B.C., even though the latter has a bigger population. In part, this reflects the capital intensity of Alberta’s economy, particularly the outsized presence of the energy sector in the province. Oil and gas extraction, refining/processing, and pipeline transport are among the highest-productivity industries in Canada. Relatedly, the GDP value of Alberta’s exports (to other countries and provinces combined) far exceeds that in B.C., again mainly because of the size and pronounced export orientation of Alberta’s oil and gas industry.
Gross fixed capital formation represented almost one-quarter of Alberta’s GDP in 2025; in B.C., the share was similar. At first glance this seems puzzling, given the concentration of the high-productivity energy industry in Alberta. Two factors explain why B.C.’s aggregate investment/GDP ratio almost matches that in Alberta: i) housing-related investment spending accounts for a larger slice of the economy in B.C. (7.4% vs 5.8% in Alberta in 2025); and ii) public sector investment outlays are also larger in B.C. as a share of GDP (5.1% vs 2.6% in Alberta in 2025). Similarly, government consumption spending – across all levels of government – made up one-fifth of British Columbia’s GDP in 2025; in Alberta, the share was smaller – about 17%. By almost any measure, government activity is a bigger driver of the economy in B.C. than in Alberta. Whether this pattern will persist under a new B.C. government facing both epic budget deficits and a ballooning provincial debt remains to be seen.
Figure 3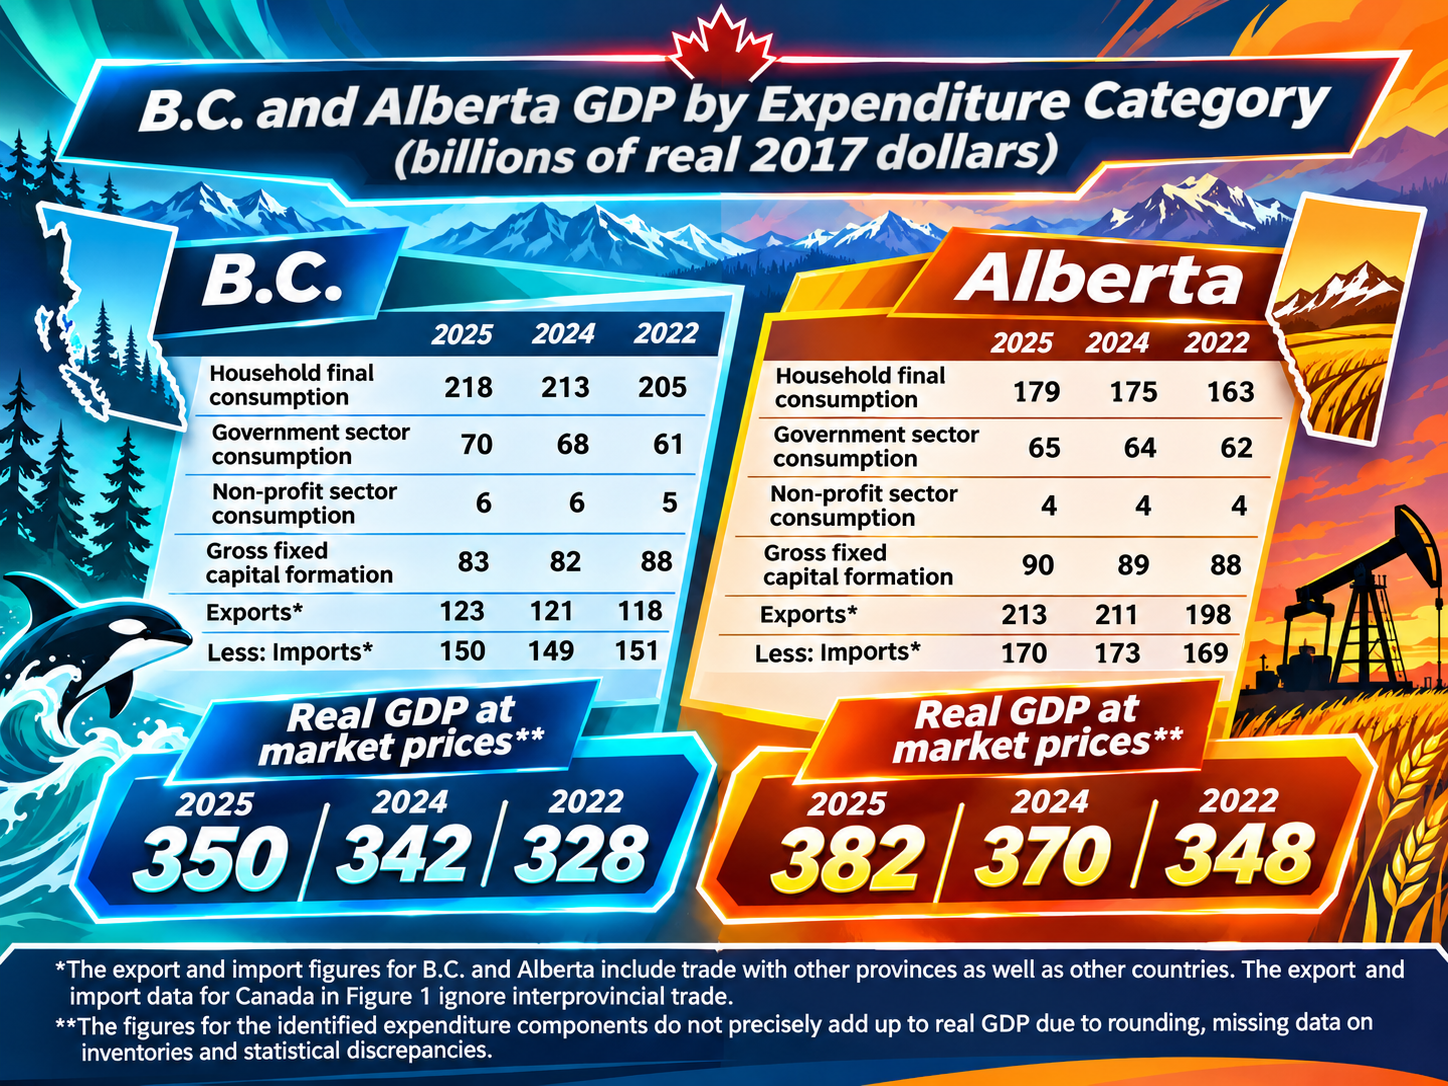
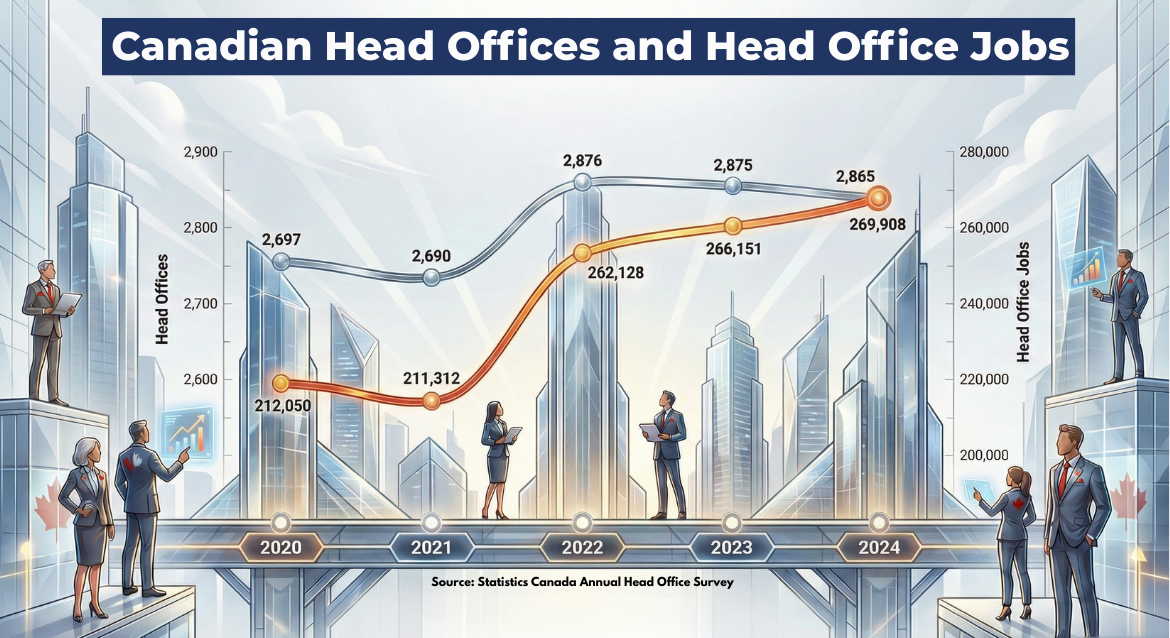
Statistics Canada’s survey highlights the growth of corporate head offices in B.C. and Alberta, underscoring their economic impact and employment...

Canada faces an entrepreneurial drought, with new business formation lagging behind closures. This trend threatens economic growth and innovation...
B.C. faces a housing slump while Alberta's market thrives. Explore the latest Statistics Canada data on residential investment and job impacts across...