Most tangible assets eventually become obsolete and must be replaced after years of wear and tear. This explains why the Income Tax Act enables the owners of non-residential capital assets to claim depreciation expenses when calculating their tax bills.
Geographically, Canada is a very large country in which economic development historically has involved massive investments in infrastructure and other physical assets to build a modern industrial economy and to facilitate the movement of people and goods – e.g., roads and highways, pipelines, electricity grids, bridges and tunnels, seaports, canals and inland waterways, and telecommunications networks. As the population and economy have grown and various industries have been established and expanded over time, businesses have made substantial investments in assets ranging from factories, mines and mills to commercial and industrial buildings, technology parks, research and development facilities, and a diverse array of machinery and equipment.
Each year, Statistics Canada publishes estimates of the “service life ratios” of the physical assets that – taken together -- make up the country’s non-residential capital stock. The service life ratio measures the percentage of an asset’s “useful” life that is left. To take an example: if an asset – say an industrial building – is deemed to have a 20-year service life and its remaining life is 15 years, then the service life ratio is 75%. A higher ratio means an asset has more time – relative to its estimated life, which varies greatly across asset categories -- before it needs to be replaced or rebuilt.
Overall, Statistics Canada estimates the remaining useful service life of the country’s non-residential capital stock at 63.3% (as of 2023). The ratio has fallen for eight consecutive years and is now lower than at any time since 2009. A declining service life ratio is a strong indication that capital investment in infrastructure, buildings, production facilities, and other tangible assets needs to increase to keep the economy productive and competitive.
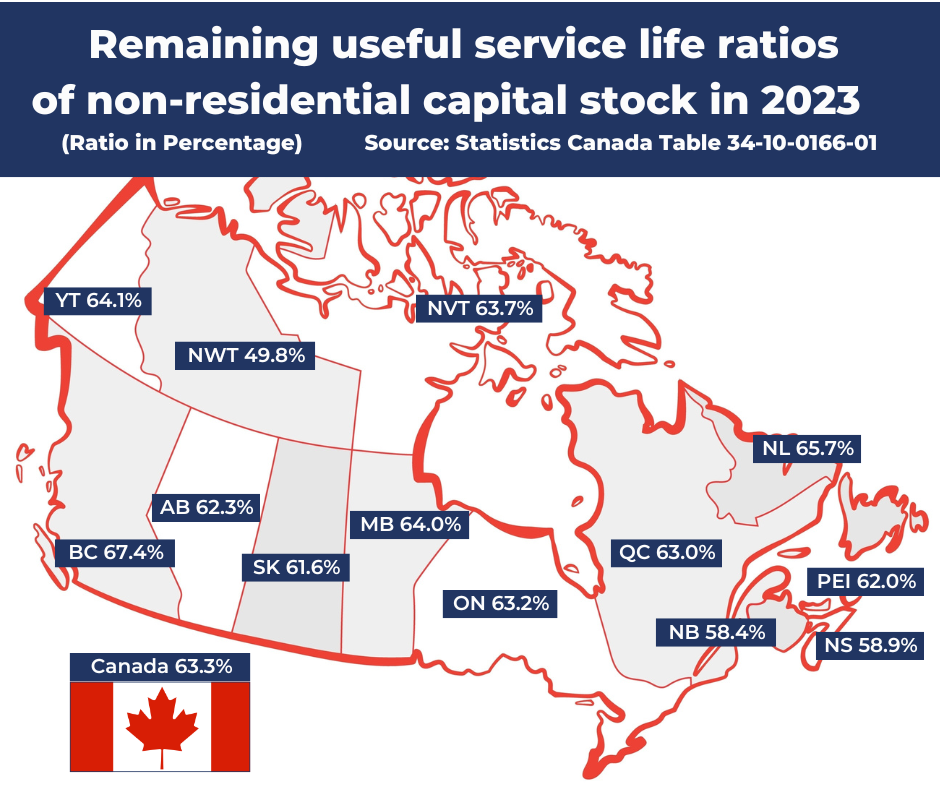
Figure 1 shows the average remaining useful service life ratios across the individual provinces/territories. British Columbia has the highest remaining service life ratio, which may be surprising given a pattern of relatively weak investment in some parts of the B.C. private sector since the late 2010s. However, Statistics Canada notes that the increase in B.C.’s service life ratio in the last few years is almost entirely due to “investments in construction related to the liquified natural gas terminal near Kitimat.” The unprecedented size and scale of the Kitimat LNG project pushed up the aggregate service life ratio in B.C.
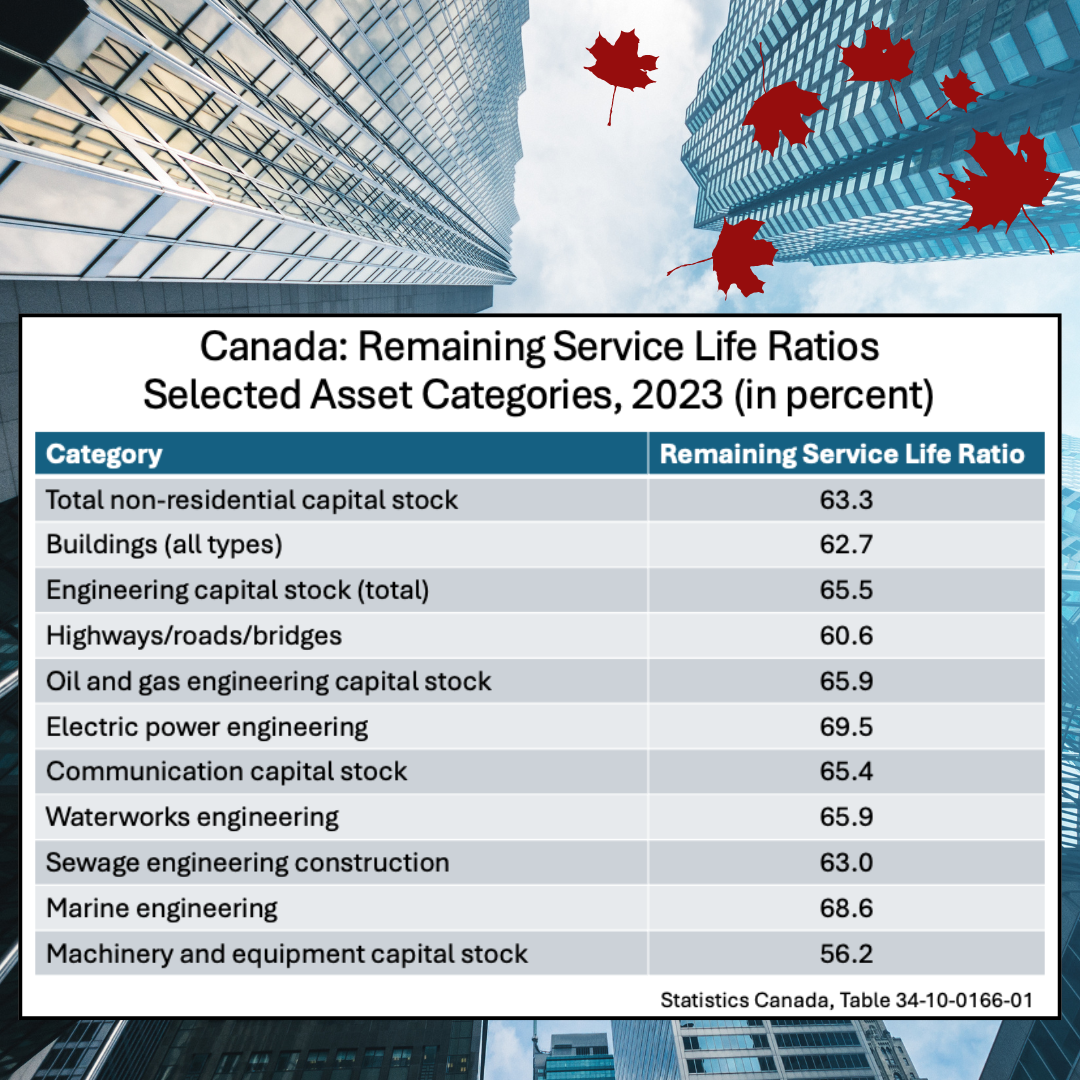
Figure 2 provides data on the remaining service life ratios for various asset categories at the Canada-wide level. The highest ratios – equating to larger percentages of remaining useful life – are found in electric power engineering, marine engineering, and parts of oil and gas engineering construction. The other main asset categories listed are closer to the end of their useful economic lives, with highways/roads/bridges in relatively poor shape on this particular metric.
Turning to the machinery and equipment portion of the Canadian non-residential capital stock, the average service life ratio stood at just 56.2 in 2023. This is another sign that Canada needs to step up the pace of investment in machinery and equipment assets in the coming years.